- Building a 3D Digital Clock with ArduinoPosted 4 months ago
- Creating a controller for Minecraft with realistic body movements using ArduinoPosted 5 months ago
- Snowflake with ArduinoPosted 5 months ago
- Holographic Christmas TreePosted 5 months ago
- Segstick: Build Your Own Self-Balancing Vehicle in Just 2 Days with ArduinoPosted 6 months ago
- ZSWatch: An Open-Source Smartwatch Project Based on the Zephyr Operating SystemPosted 7 months ago
- What is IoT and which devices to usePosted 7 months ago
- Maker Faire Rome Unveils Thrilling “Padel Smash Future” Pavilion for Sports EnthusiastsPosted 7 months ago
- Make your curtains smartPosted 8 months ago
- Configuring an ESP8266 for Battery PowerPosted 8 months ago
ANTENNINO a gateway for the IoT – ThingsBoard

Let’s make a Dashboard for the gateway Antennino network, using open-source software that allows us to implement a control panel for our wireless devices.
We left, at the end of the first episode after describing the hardware of the new Gateway for Antenninos, based on the powerful NodeMCU ESP 32, and introducing the open-source software Thingsboard, which has allowed us to develop the Dashboard for the remote management of peripheral Antennino modules and data collectors.
Remember that the purpose of the Gateway is to provide a network of Antennino sensors, then a network of sensors for the IoT on edge, on the Internet and make it interact with the web. The application that is the Dashboard that realizes all this has been realized thanks to ThingsBoard that is an open software developed to create Dashboards to be used in Internet of Things systems (not by chance it’s called ThingsBoard).
In this final episode, we will take up the discussion from it, from its use and the creation of our personalized Dashboard, that we will use to work on the sensors network based on the standard Antennino modules.
ThingsBoard
Here we will not deal with the installation procedure of ThingsBoard because it is trivial and would require more space here in the article; those who want to learn more about the subject can find detailed and updated descriptions of the various installation procedures, with suggestions as to appropriate in the ThingsBoard site.
As mentioned in the first episode, if your only interest is doing a test, you can use the live version of ThingsBoard, which provides you with a complete, personal and customizable environment, without having to install it.
What we will do in these pages is to focus on the configuration of the dashboard to highlight how it is possible to collect telemetric data from a couple of Antennino nodes (i.e., modules set as a peripheral node), display the corresponding data on graphs or analog indicators, remotely control a pin on the Antennino through a virtual button on the dashboard, send e-mail alerts, a message on Telegram or a PushNotification, when a particular parameter exceeds a threshold set by us.
We will also make custom widgets and all JSON configuration files available for testing with the Gateway, so you need to import the various JSON files to find your environment configured and ready to work. Let’s start with the registration procedure in the test environment.
So, we begin working with our ThingsBoard: first of all, you have to go to the web page, where you can register to be able to configure your Dashboard; the Fig. 1 shows its appearance.

Fig. 1
Once you have finished registering, you must open the web page https://demo.thingsboard.io/home (Fig. 2) to access your personal dashboard with your credentials and start to become familiar with the environment.

Fig. 2
In Fig. 3 you can see how the homepage of our DashBoard looks: on the left, we have a menu containing all the main items, and in the center, we have the same items proposed in tile mode (icons).

Fig. 3
Let’s inspect the main items: note that selecting a single item on the left menu or from the central icon opens a window in which are listed all the objects contained in this item. To see the details, you have to click on the element concerned or enter in “editing” mode.
The described behavior is repeated for each menu item.
Rule Chain
This item (Fig. 4) is the heart of the whole system and allows you to configure behavior based on events. Clicking on the menu item or the corresponding icon opens a window containing the Root Rule Chain, containing if any, the items.

Fig. 4
Opening the detail, you can see that the appearance is very similar to that of Node Red and probably is mediated by that and declined to the specific use of ThingsBoard.
You can visually define (with the simple Drag and Drop of the components on the screen) the behavior of the system using the predefined objects on the left and relate them to each other through the arrows of connection.
You can also insert a custom block containing custom code.
Don’t be afraid of this, because we’re not going to touch this configuration for the moment. We’ll leave it the way it is after installation. We will dedicate space to this essential section in future articles, which we will propose on the theme of alarm management and notifications.
Customers
This option (Fig. 5) allows you to define specific customers to whom to assign the Devices of the network managed through the Dashboard.

Fig. 5
Devices
The Demo Dashboard is already populated (Fig. 6) with a series of devices you can experiment with, on the site are indicated detailed instructions on how to do tests.

Fig. 6
Widgets Bookcase
This option contains a series of Widget families (Fig. 7) that you can use in our Dashboards. For example, we can visualize data such as temperature or pressure, using Analogue Gauge as it is visible in Fig. 8.

Fig. 7
From here, you can also create your widgets by copying and customizing existing ones or create one from scratch. Besides, as mentioned above, you can download the definition of the Widget in JSON format for backup purposes or to create a new one based on an existing one (Fig. 9).

Fig. 8
Once you have downloaded the file, you can open it with Notepad++ and edit its name in the text file, reload it (Fig. 10), so that you are ready to create your widget.

Fig.9
At the web address https://thingsboard.io/docs/user-guide/contribution/widgets-development/ you can find the guidelines for the Widgets programming. The skills needed to develop custom widgets imply a relatively in-depth knowledge of how ThingsBoard works, but also of HTML, CSS, AngularJS, and JSON.

Fig. 10
DashBoard
This is the ThingsBoard visual part (Fig. 11), or the control panel, indeed the control panels, which allow having a view on the devices. As you can see, there are already several configured Dashboards, and they are all very interesting. We recommend that you experiment with all of them if you have the necessary hardware.

Fig. 11
By double-clicking on one of the existent Dashboards it is possible to inspect its appearance and, if necessary, entering the editing mode (Fig. 12), (130×82 mm) to modify the positioning and the dimensions of the various Widgets that compose it. In editing mode, you enter by clicking on the orange button in the lower right corner, showing the pencil symbol.

Fig. 12
To edit the properties of the single Widgets, it is necessary to click on the symbol of the pencil present on the upper right border of the Widget that you want to edit (Fig. 13).

Fig. 13
Once you have completed the editing operation, you are faced with something similar to what is proposed in Fig. 14 that reports the editing of a specific widget.
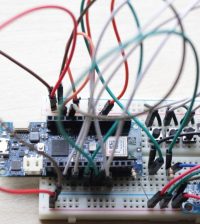
Well, we have finished the Dashboard description, and now that we have given you all the information useful to create a custom, we move on to the last step of the project, namely the implementation of the Gateway hardware for the IoT sensors network on Antennino.

Fig. 14
Conclusion
Well, we are done with this. We have introduced the realization of the Antennino Gateway that will allow us to connect our network of devices to a Thingsboard Dashboard, we have illustrated the peculiarities of the Gateway and introduced the MQTT protocol and the IoT ThingsBoard Dashboard.
We want to remind you that the various Sketches can be downloaded from the Github repository, where you can also download the libraries used for the project.
From openstore
ANTENNINO – Arduino-RF multifunction board
ESP-WROOM-32 ESP32 ESP-32S Development Board
Breakout Board with RFM69 (434 MHz)
DC/DC Power Converter 1.5V ÷ 35V / 3A

Related Posts


-
 Arduino ISP (In System Programming) and stand-alone circuits
We use an Arduino to program other ATmega without...
- Posted 12 years ago
-
-
-
 GSM GPS shield for Arduino
Shield for Arduino designed and based on the module...
- Posted 12 years ago
-
 Small Breakout for SIM900 GSM Module
Some post ago we presented a PCB to mount...
- Posted 13 years ago
-
 Join Maker Faire Rome 2024: Innovation Unleashed at Gazometro Ostiense | Calls Now Open!
All Calls Now Open for Maker Faire Rome 2024...
- Posted 2 weeks ago
-
 Building a 3D Digital Clock with Arduino
Project to create a digital clock consisting...
- Posted 4 months ago
-
 Acoustic amplifier – in DIY Kit
This kit creates a microphone amplifier with an output...
- Posted 5 months ago
-
 Creating a controller for Minecraft with realistic body movements using Arduino
Project of a controller that maps body movements...
- Posted 5 months ago
-